
YouTube’s native analytics are powerful, but they don’t always tell the whole story or connect performance to your broader marketing goals. A well-designed dashboard transforms raw data into a strategic command center, giving you instant clarity on what’s working, what’s not, and where your next big opportunity lies. Without one, you’re navigating a sea of metrics without a compass, making it difficult to link video views to tangible business outcomes like lead generation or sales.
Is your YouTube strategy delivering real results? We offer a free audit of your marketing or PPC strategy. Let us show you how to connect your YouTube efforts to bottom-line growth. Request Your Free Audit Today
This guide moves beyond the standard YouTube Studio interface to showcase practical youtube dashboard examples that solve specific business problems. We will explore curated dashboards tailored for different objectives, from high-level executive summaries that track revenue impact to granular content performance trackers that inform your creative strategy.
Here, you’ll find a collection of actionable dashboard examples from platforms like Databox, Klipfolio, and Supermetrics. Each example includes a screenshot, a breakdown of key KPIs, and a clear rationale for its layout. We’ll provide specific takeaways and quick implementation tips, so you can stop guessing and start making data-driven decisions that accelerate your channel’s growth and directly contribute to your company’s bottom line. Let’s dive into the dashboards that will give you the strategic vision you need.
1. Databox
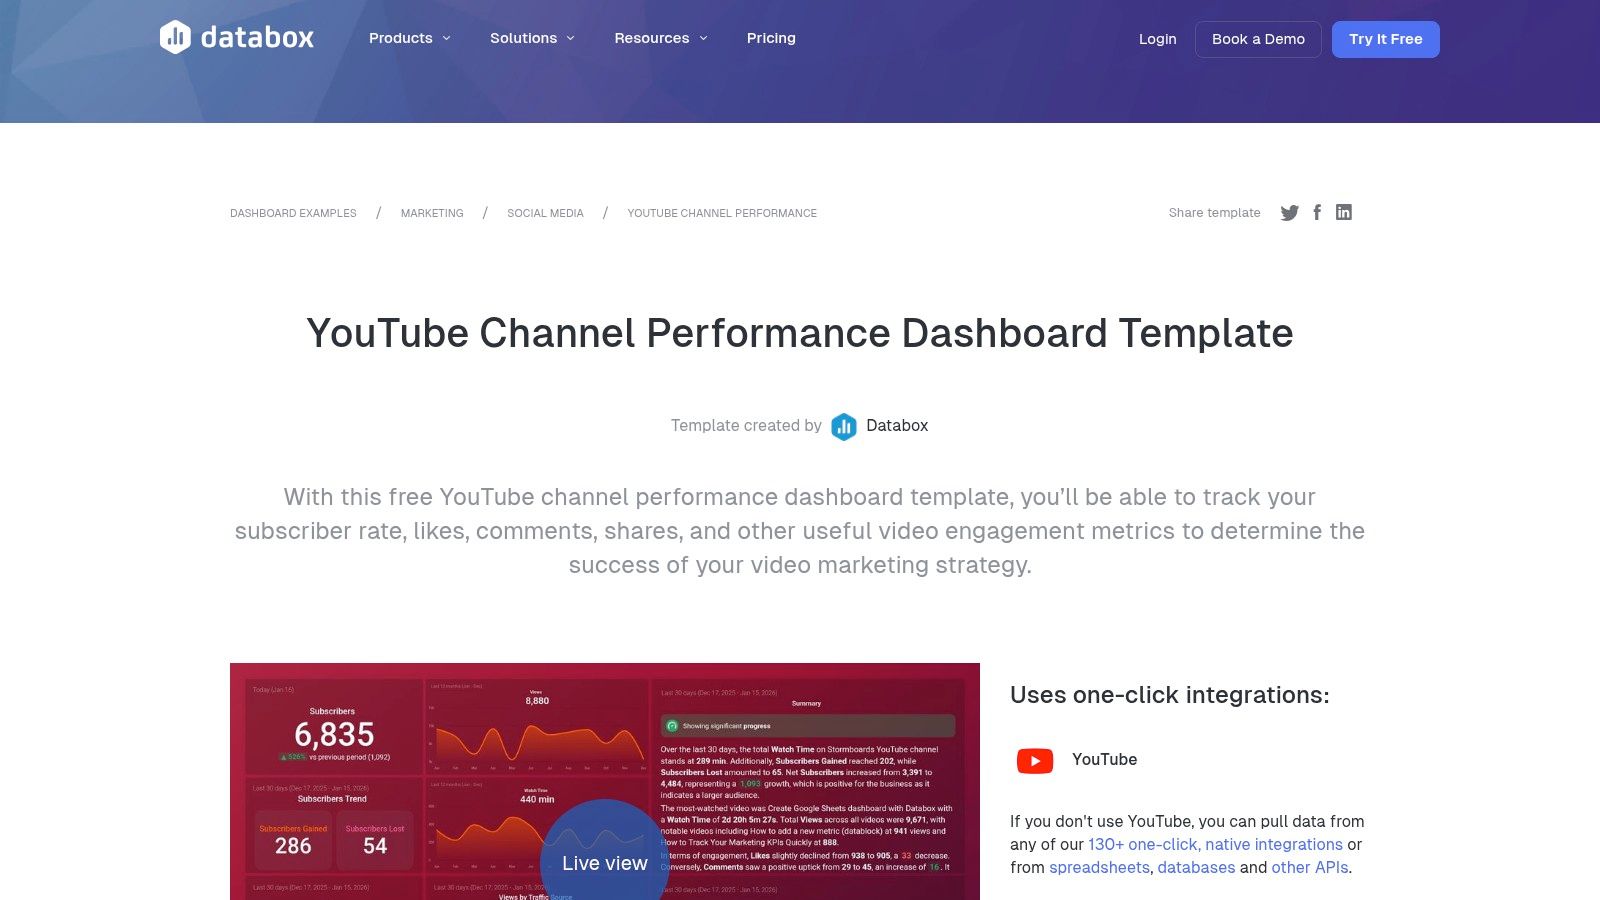
Databox excels at providing rapid, plug-and-play dashboarding solutions perfect for marketing agencies, content teams, and businesses that need immediate insights without a complex setup. Its core strength lies in a vast library of pre-built templates and over 130 native integrations, allowing users to connect their YouTube Analytics data with just a few clicks and visualize performance instantly. This makes it an excellent choice for teams that prioritize speed and efficiency over deep, custom-coded data analysis.
Key Features and Strategic Advantages
Databox’s platform is built around usability and cross-channel reporting. Unlike tools that require extensive knowledge of APIs or data warehousing, Databox automates the data connection process. This empowers marketers to focus on strategy rather than data wrangling.
Strategic Insight: The primary value of Databox is its ability to blend YouTube performance metrics with data from other marketing platforms (like Google Analytics, HubSpot, or Facebook Ads) in a single view. This holistic perspective is crucial for understanding how YouTube content drives broader business goals, such as website traffic, lead generation, or sales.
Key offerings include:
- Template Library: Access to dedicated YouTube templates like “Channel Performance,” “Watch Time Analysis,” and “Multiple Channel Overview.”
- One-Click Integrations: Seamlessly connect to YouTube Analytics and other sources without writing any code.
- Customization: While templates offer a quick start, users can easily customize dashboards by adding, removing, or rearranging pre-built widgets (databoards).
- Sharing and Reporting: Generate shareable links, schedule automated reports via email or Slack, and display live dashboards on office TVs using “TV Mode.”
Implementation and Pricing
Getting started is straightforward. Users select a template, authorize Databox to access their YouTube account, and the dashboard populates automatically. While Databox previously offered a free tier, it was sunset on July 1, 2025. Today, all plans are paid, starting from a trial period, which may be a consideration for individual creators or small businesses. The paid plans offer significant value, particularly for agencies, as they include unlimited users, which simplifies team and client collaboration.
For those managing multiple clients, Databox’s structure is particularly well-suited for creating replicable and scalable reporting systems, similar to what’s discussed in these SEO dashboarding tools post. This template-driven approach ensures consistency and saves countless hours each reporting cycle.
Website: https://databox.com/dashboard-examples/youtube-channel-performance-dashboard
2. Geckoboard
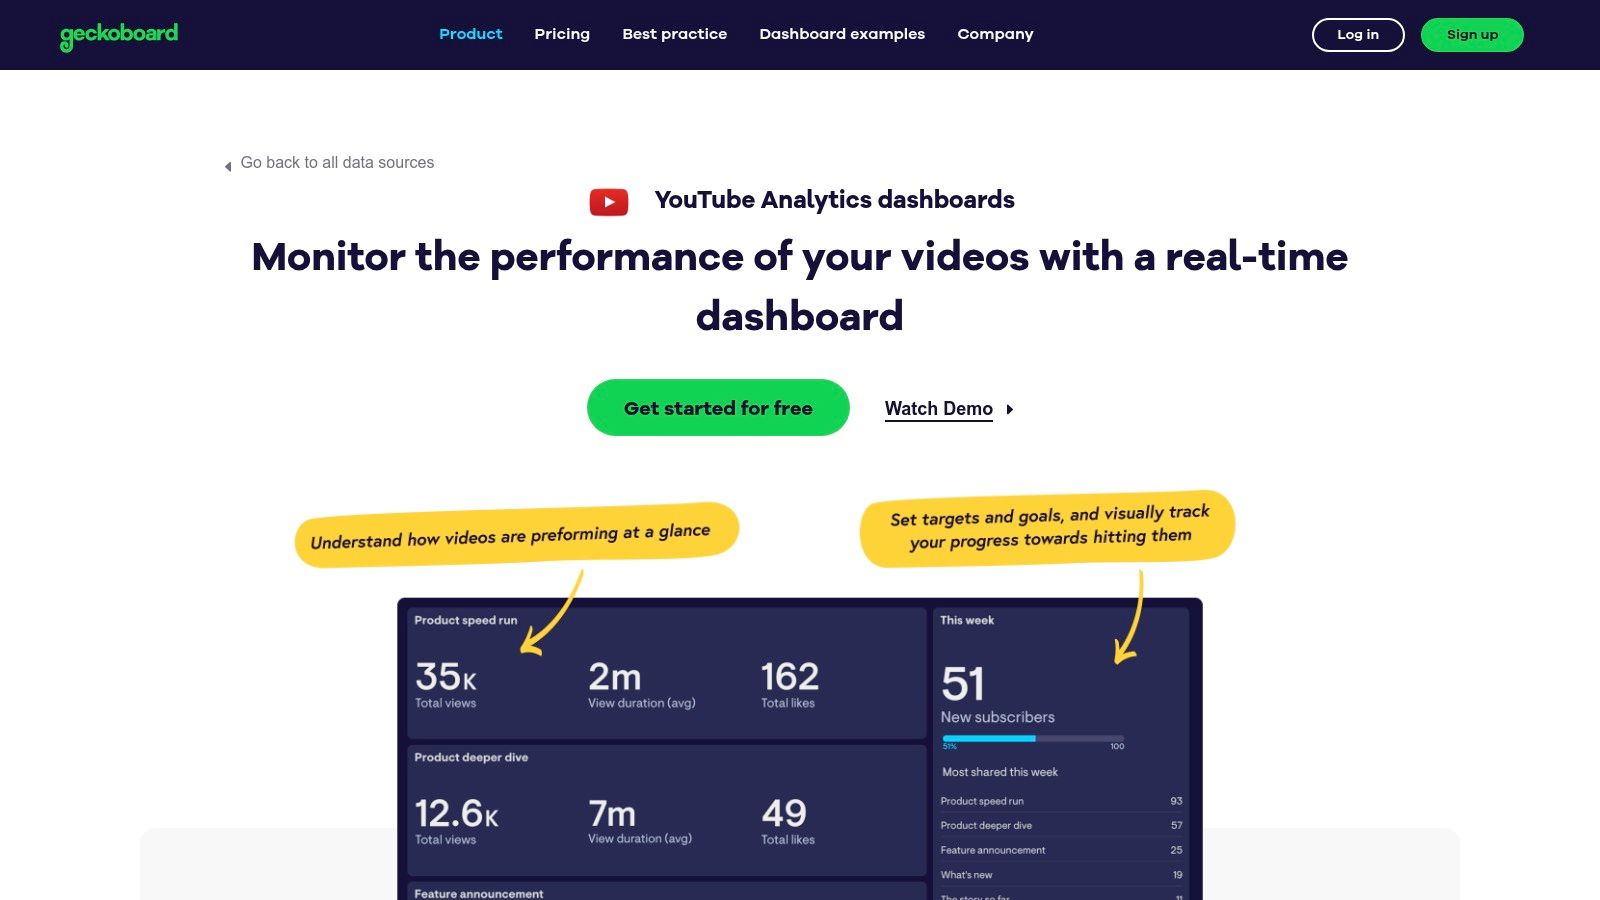
Geckoboard specializes in creating clear, shareable, and always-on dashboards optimized for big-screen displays, like office TVs. Its strength is simplicity and real-time monitoring, making it a go-to choice for teams that need at-a-glance performance updates. The platform uses a native YouTube connector and drag-and-drop interface, allowing users to quickly build and broadcast key metrics without needing any technical expertise. This focus on “wallboard” style reporting is ideal for keeping entire teams aligned on channel growth and content engagement.
Key Features and Strategic Advantages
Geckoboard is designed for operational visibility. Instead of deep, granular analysis, its purpose is to surface the most important KPIs in a highly digestible format for a broad audience. The connection process is seamless, using a documented Google authentication flow that populates widgets with live data almost instantly. This ease of use empowers teams to track progress against goals in real-time.
Strategic Insight: Geckoboard’s main advantage is its ability to foster a data-aware culture. By displaying YouTube performance on a central screen, it makes channel metrics a constant, visible part of the team’s environment. This is especially powerful for motivating content teams, celebrating milestones, and quickly spotting performance dips without waiting for a formal report.
Key offerings include:
- Native YouTube Connector: A pre-built integration with a catalog of supported metrics like views, watch time, likes, and subscriber changes.
- Drag-and-Drop Editor: Easily build layouts by dragging pre-configured widgets and KPIs onto a canvas.
- Goal and Status Indicators: Set targets for metrics and use visual cues (like green/red indicators) to show progress at a glance.
- TV Mode and Sharing: Optimized for large-screen displays and provides simple sharing via public links for stakeholders.
Implementation and Pricing
Setting up a Geckoboard dashboard is incredibly fast. Users connect their Google account, select YouTube as the data source, and then choose from a list of available metrics to add to their board. The entire process can take just a few minutes.
Pricing is plan-based and scales with the number of dashboards and users. While this can become more costly than some competitors for organizations needing many unique dashboards or editors, its value is high for teams focused on broadcasting a few critical dashboards to a wide internal audience. The platform’s clear connection flow and focus on real-time displays make it one of the best tools for measuring marketing performance for operational teams.
Website: https://www.geckoboard.com/product/data-sources/youtube/
3. Klipfolio
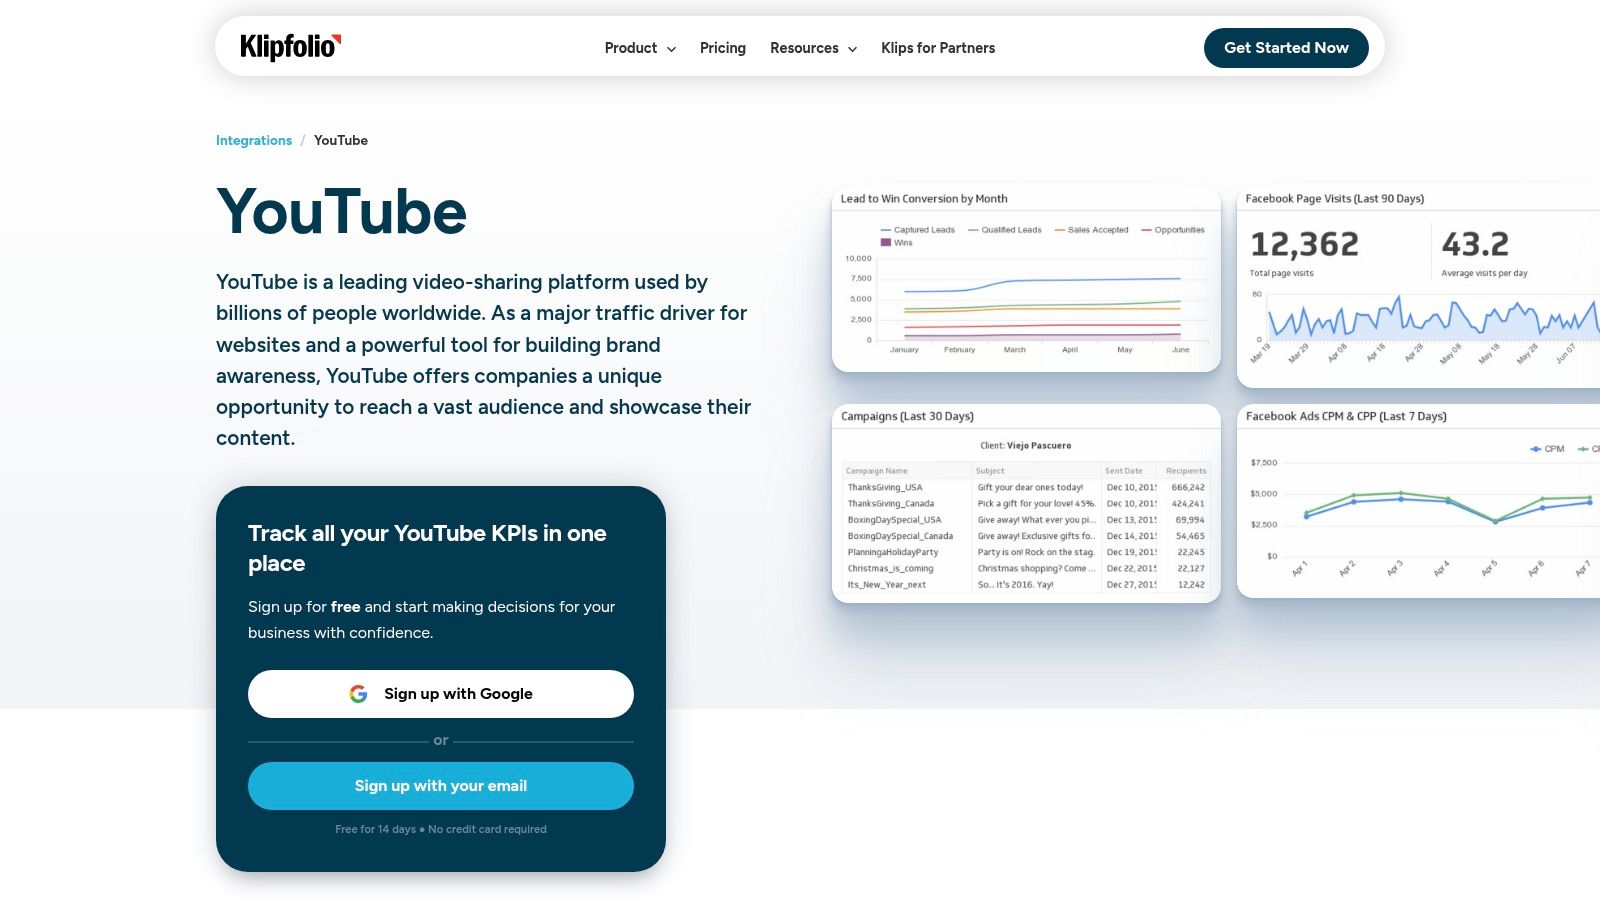
Klipfolio positions itself as a powerful, highly customizable business intelligence platform for teams that have outgrown basic templates and require more granular control over their data. It’s an ideal solution for data-savvy marketing teams and agencies that need to build bespoke YouTube dashboards by directly querying the YouTube API, blending channel metrics with data from diverse business systems like CRMs, ad platforms, and analytics tools. Klipfolio’s strength lies in its flexibility, catering to users who need to move beyond standard KPIs to create truly custom visualizations.
Key Features and Strategic Advantages
Klipfolio balances pre-built components with deep customization capabilities. While it offers “Klips” (pre-built widgets) for common YouTube metrics to accelerate setup, its true power is in the Connector Gallery. This feature allows users to construct their own API queries to pull specific, non-standard data points directly from YouTube Analytics, giving them complete control over the information they visualize.
Strategic Insight: Klipfolio’s primary advantage is its ability to build advanced, multi-source dashboards that reflect unique business logic. For example, a team can combine YouTube view velocity data for a new product video with sales data from their CRM and website traffic from Google Analytics. This creates a comprehensive view of how video content directly influences the sales funnel, a level of analysis that plug-and-play tools often cannot achieve.
Key offerings include:
- Pre-built Klips: Quickly add standard metrics like Top 10 Videos, subscriber growth, and overall views to get a dashboard started.
- Connector Gallery: Build custom YouTube API queries to access any metric you need without being limited by pre-defined integrations.
- Advanced Customization: Enjoy full control over widget design, data manipulation, and formulas to create highly specific and branded client reports.
- Extensive Support: Access a mature library of help documentation and implementation services, which is invaluable for teams tackling complex dashboard builds.
Implementation and Pricing
Setting up Klipfolio involves more configuration than simpler template-based platforms. Users start by connecting their YouTube account and can either use pre-built Klips or dive into the data source editor to write custom queries. This initial learning curve is a trade-off for its high degree of flexibility. The platform’s structure is particularly robust for agencies that need to deliver bespoke reporting, a core component of becoming a modern, data-driven marketing agency.
Klipfolio offers several pricing tiers, with its most powerful features, like advanced data source connections and higher refresh rates, reserved for its higher-tier plans. This pricing model makes it a better fit for established businesses and agencies rather than individual creators on a tight budget. The investment is justified for teams that require deep, custom insights to drive strategic decisions and prove ROI across multiple marketing channels.
Website: https://www.klipfolio.com/integrations/youtube-dashboard
4. DashThis
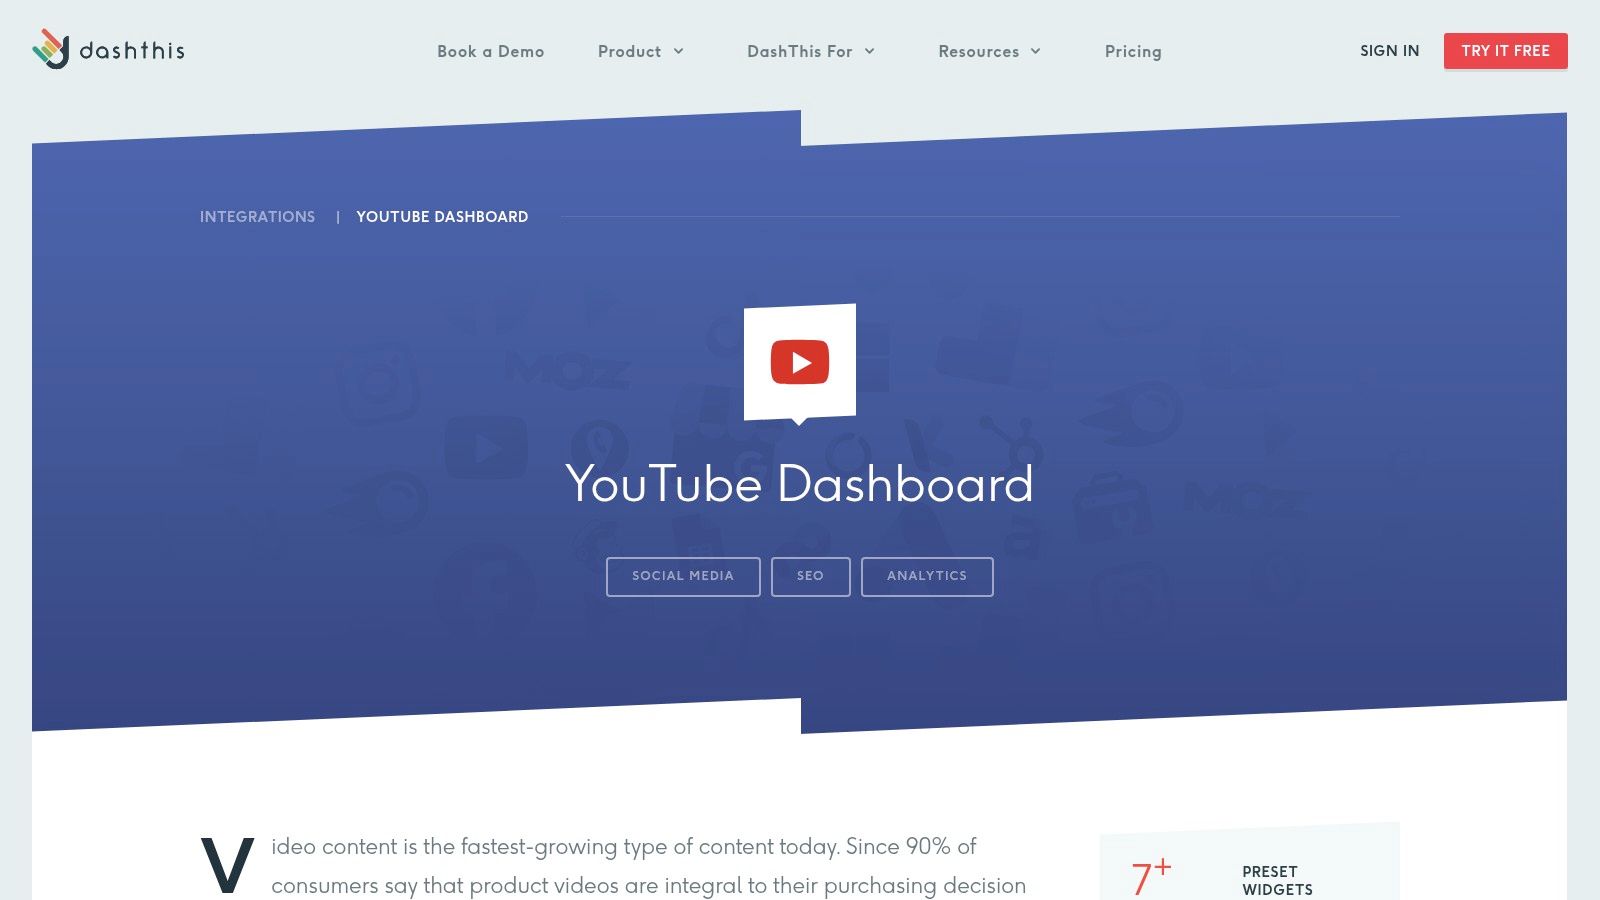
DashThis is engineered for marketing agencies and teams that require streamlined, repeatable reporting processes. It excels at creating clean, professional-looking dashboards that blend YouTube analytics with data from other marketing channels. Its primary strength lies in its template-driven workflow and preset widgets, which allow users to quickly generate comprehensive reports for clients or internal stakeholders without getting bogged down in complex data configurations. This makes it an ideal solution for standardizing reporting across multiple accounts.
Key Features and Strategic Advantages
DashThis is built around the principle of efficiency, particularly for client-facing reporting. The platform’s drag-and-drop interface and library of pre-configured YouTube metrics (like Views, Subscribers, Comments, and Estimated Minutes Watched) simplify the dashboard creation process significantly. This focus on ease-of-use empowers agencies to deliver consistent, high-quality reports on a recurring schedule with minimal manual effort.
Strategic Insight: DashThis’s core value proposition for agencies is its ability to create a single, unified report that includes YouTube, Google Ads, Facebook Insights, and other key channels. This prevents the need for exporting multiple CSV files and manually compiling data, saving valuable time and reducing the chance of human error. It allows teams to present a cohesive narrative of how YouTube efforts are impacting the entire marketing funnel.
Key offerings include:
- Preset YouTube Widgets: Quickly add standard YouTube KPIs to your dashboard with pre-built widgets for faster reporting.
- Drag-and-Drop Builder: Easily customize the layout and content of your reports to match specific client needs or internal goals.
- Cross-Platform Reporting: Combine data from YouTube and dozens of other marketing integrations into a single, seamless dashboard.
- Recurring Report Automation: Schedule reports to be sent automatically via email as a PDF or through a shareable link, ensuring stakeholders always have the latest data.
Implementation and Pricing
Setting up DashThis is straightforward: you select a template, connect your YouTube account, and then drag the desired widgets onto your dashboard canvas. A critical requirement is that the connected YouTube account must have Brand Account, Owner, or Manager permissions; personal accounts cannot be integrated. This is a key consideration for agencies needing to request the correct access level from clients.
Pricing is transparent and based on the number of dashboards you need, which is a simple model for agencies to scale as their client base grows. Plans start with a 15-day free trial. While the core functionality is robust, some advanced features like AI Insights Pro are available as paid add-ons. This structure makes DashThis a predictable and scalable investment for teams that prioritize standardized, automated client deliverables.
Website: https://dashthis.com/integrations/youtube-dashboard/
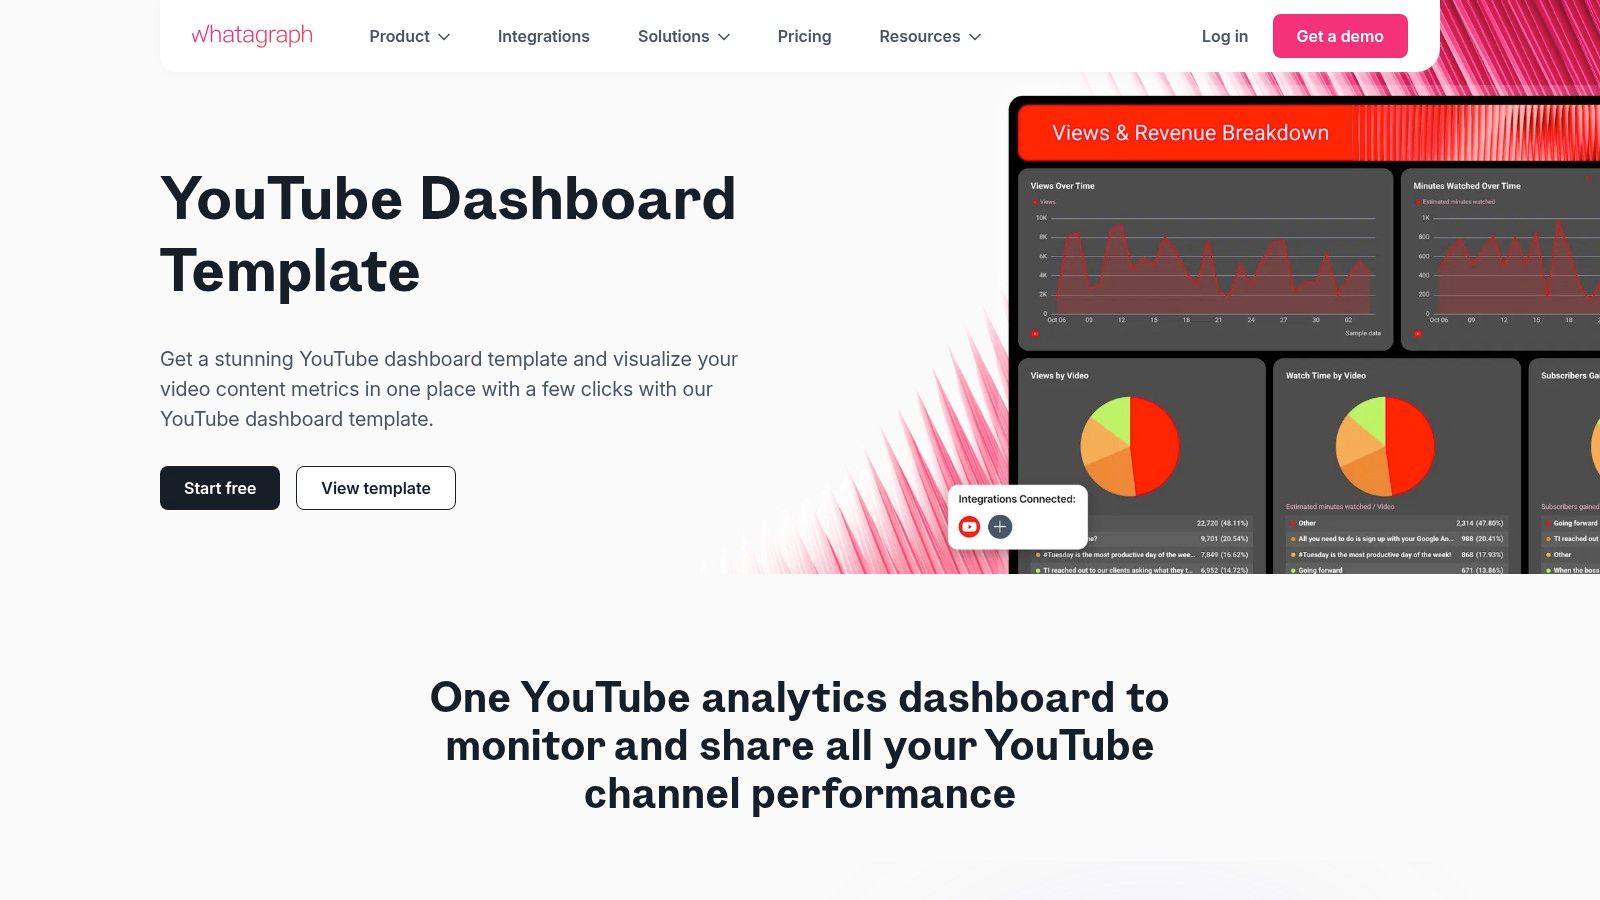
5. Whatagraph
Whatagraph is a marketing reporting tool designed for agencies and in-house teams that need to create visually appealing, cross-channel performance reports with minimal effort. Its strength lies in its ability to quickly connect to various marketing platforms, including YouTube, and populate pre-built, client-ready templates. This makes it a powerful choice for those who need to communicate YouTube’s impact alongside other paid and organic marketing efforts without getting lost in complex data manipulation.
Key Features and Strategic Advantages
Whatagraph’s platform is built around automation, speed, and presentation. It removes the manual work of pulling data and formatting reports, allowing marketers to focus on delivering insights. The interface is intuitive, enabling users to generate comprehensive dashboards that are both informative and easy for stakeholders to understand.
Strategic Insight: Whatagraph excels at contextualizing YouTube performance. Its primary value is demonstrating how YouTube metrics contribute to broader campaign goals by placing them side-by-side with data from sources like Google Ads, Facebook Ads, and social media platforms. This is ideal for agencies needing to prove the channel’s ROI within an integrated marketing strategy.
Key offerings include:
- Pre-built Templates: Offers professionally designed YouTube dashboard templates that auto-populate once connected, saving significant setup time.
- Cross-Channel Reporting: Easily combine over 80 YouTube metrics with data from other marketing channels to create a unified performance overview.
- Agency-Focused Features: Provides white-labeling and custom branding options, allowing agencies to deliver polished, branded reports directly to clients.
- Automated Reporting: Schedule reports to be sent automatically via email or generate a live link for clients to view real-time data.
Implementation and Pricing
Setting up a Whatagraph dashboard is a simple, no-code process. Users choose the YouTube template, authorize their account, and the widgets populate with data instantly. From there, they can customize the layout, add metrics from other platforms, and apply custom branding.
Whatagraph offers a free plan, which is excellent for testing the platform’s capabilities with a limited number of sources. Paid plans are structured in tiers and operate on a credit-based system, where each data source consumes credits. This pricing model can become costly for agencies managing a large number of clients or channels, as advanced features and branding are reserved for higher-tier plans. However, for teams prioritizing automated, client-ready reporting, the efficiency gains often justify the investment.
Website: https://whatagraph.com/templates/youtube-dashboard/
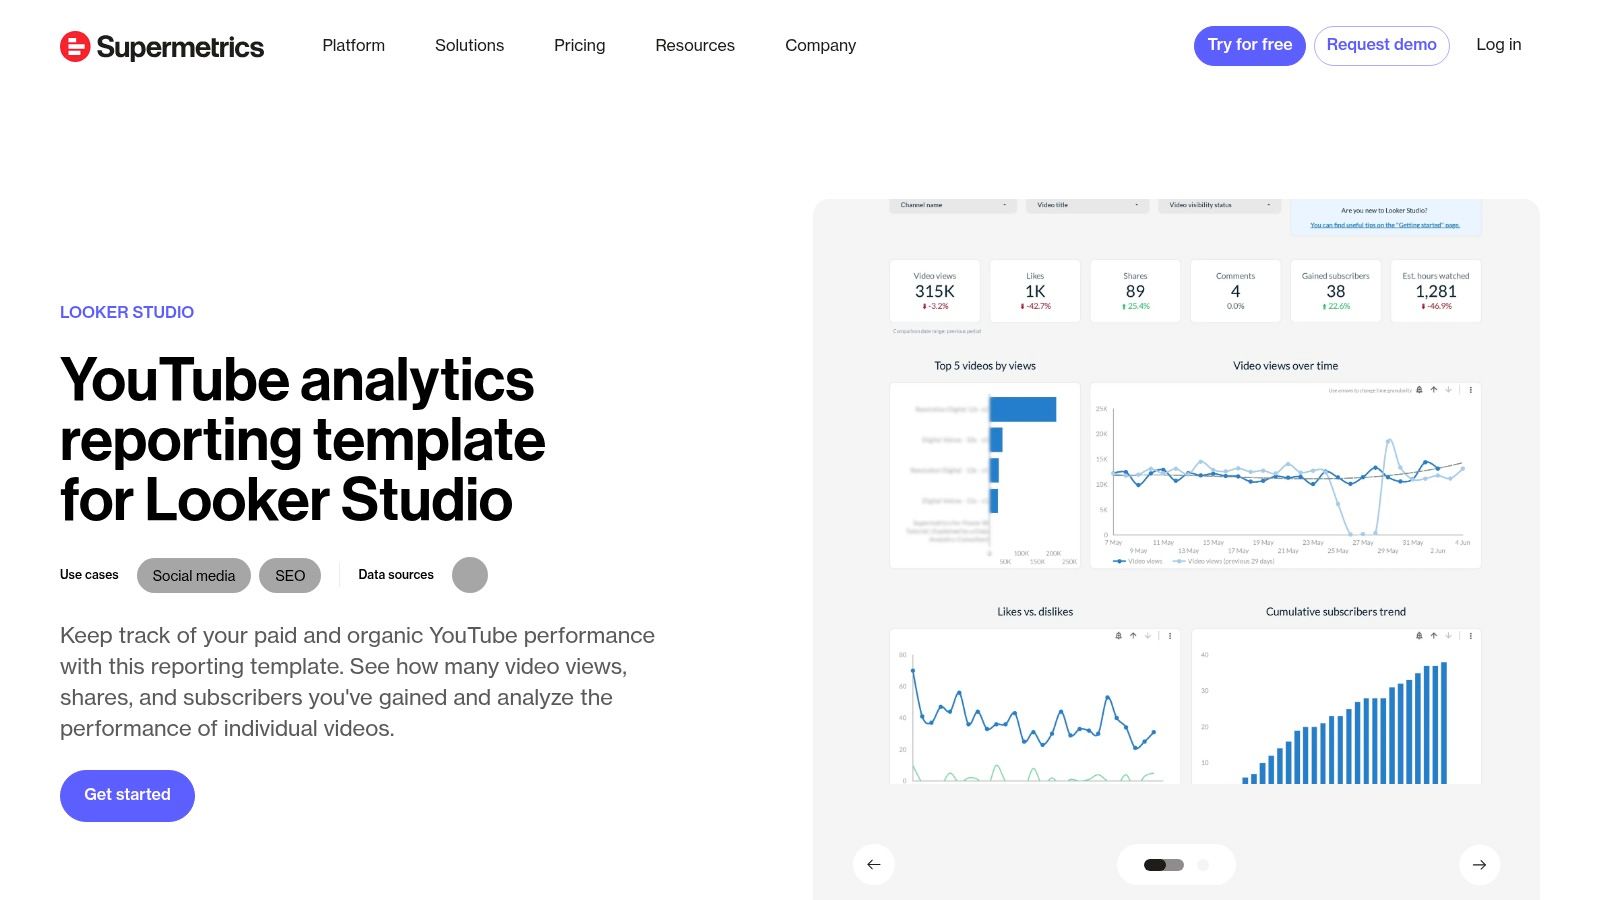
6. Supermetrics
Supermetrics excels in bridging the data gap for teams that have standardized on Looker Studio (formerly Google Data Studio) but need more granular, multi-source YouTube analytics. Its core offering is a powerful connector that pulls comprehensive YouTube data directly into Looker Studio, combined with a library of free, ready-to-use report templates. This makes it a perfect solution for marketing agencies and data-driven teams who want to leverage the flexibility of a free BI tool like Looker Studio without being limited by its native data connectors.
Key Features and Strategic Advantages
Supermetrics’ value proposition is enabling deeper, more flexible analysis within a familiar environment. While Looker Studio’s native YouTube connector is functional, the Supermetrics connector unlocks a greater depth of metrics and dimensions, allowing for more sophisticated reporting. This empowers teams to move beyond basic channel health checks and dig into nuanced performance questions.
Strategic Insight: The primary advantage of Supermetrics is its ability to centralize data from YouTube and dozens of other non-Google platforms (like Facebook Ads, LinkedIn Ads, or TikTok) into a single Looker Studio dashboard. This is crucial for agencies and enterprise teams needing to report on full-funnel marketing performance and demonstrate YouTube’s ROI alongside other paid and organic channels.
Key offerings include:
- Free Looker Studio Templates: Provides a starting point with professionally designed templates, such as the “YouTube Channel Overview,” which can be quickly connected to your data.
- Granular Data Connector: The Supermetrics connector for Looker Studio pulls a wider range of dimensions and metrics than the standard Google connector, enabling more detailed analysis.
- Multi-Source Reporting: Easily blend YouTube data with performance data from over 100 other marketing and sales platforms.
- Scalable and Standardized: Ideal for agencies that need to create and manage standardized, replicable Looker Studio reports for multiple clients, ensuring consistency and efficiency.
Implementation and Pricing
Setting up a dashboard involves selecting a free Supermetrics template from their gallery, connecting your YouTube account via the Supermetrics connector, and letting the report populate. While the templates are free, the true power comes from the Supermetrics connector, which is a paid subscription product. Supermetrics offers a 14-day free trial to test its capabilities. The ongoing connector cost can be a consideration, especially as you add more data sources or users, but it often provides a strong return on investment for teams that require robust, cross-channel reporting and can’t afford a more expensive enterprise BI platform.
Website: https://supermetrics.com/template-gallery/looker-studio-youtube-channel-overview
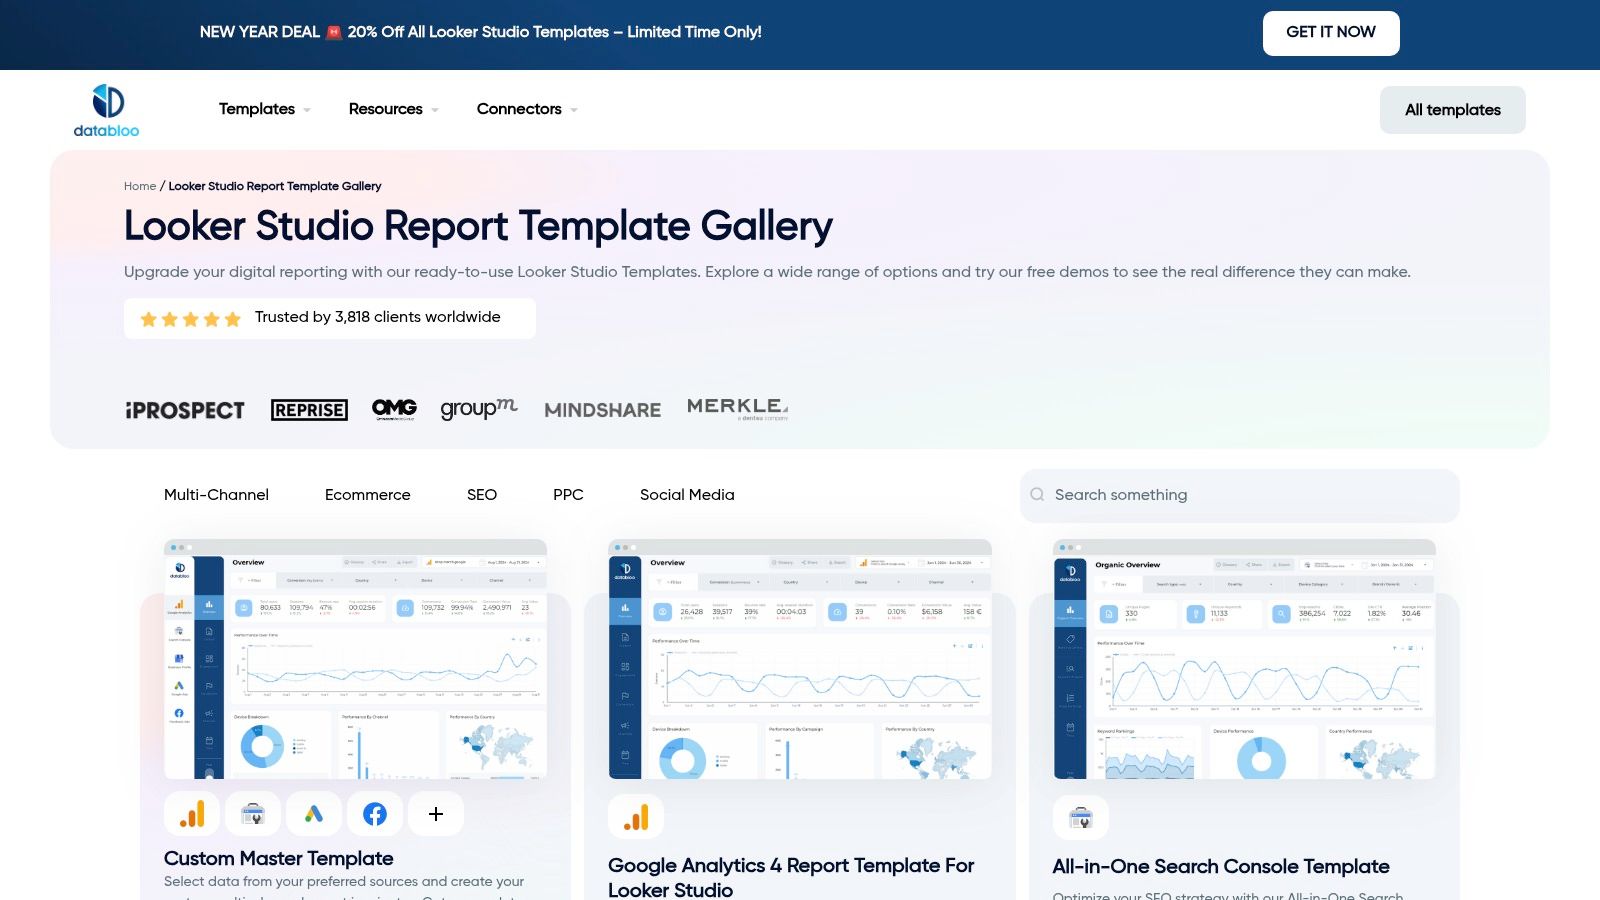
7. Data Bloo
Data Bloo offers a unique value proposition in the YouTube analytics space by functioning as a marketplace for premium, pre-built Looker Studio (formerly Google Data Studio) templates. It is designed for marketers, agencies, and data analysts who want a polished, professional-grade dashboard without investing the time and design resources to build one from scratch. Its core strength is providing beautifully designed, white-label reports that can be purchased, cloned, and instantly connected to your YouTube data.
Key Features and Strategic Advantages
Data Bloo bridges the gap between the flexibility of Looker Studio and the speed of plug-and-play dashboard tools. It allows users to leverage Google’s free and powerful visualization platform while skipping the steep learning curve of report design and data source configuration. This makes it an ideal choice for creating client-facing reports or internal presentations that require a high degree of polish and professionalism.
Strategic Insight: The primary advantage of Data Bloo is its “buy once, own forever” model for the template itself. Unlike subscription-based SaaS tools, you purchase the template and can reuse and adapt it indefinitely. This provides a cost-effective way to achieve a high-end, custom look for your YouTube dashboard examples, empowering you to present data with the same visual quality as a large agency.
Key offerings include:
- Premium Template Design: The YouTube Channel Report template is expertly designed to analyze subscriber growth, video performance, audience demographics, and key engagement metrics.
- Instant Customization: Once purchased, the template can be easily edited in Looker Studio. Users can add their own logo, change colors, and modify charts to match their brand identity.
- Multi-Channel Reporting Bundles: Data Bloo offers bundles that include templates for other platforms like Google Analytics 4, social media, and SEO, enabling a cohesive multi-channel reporting suite.
- One-Time Purchase Model: You pay a one-time fee for the template design, which can be a significant cost saving compared to the recurring fees of dedicated dashboarding software.
Implementation and Pricing
Getting started with a Data Bloo template is straightforward for anyone familiar with the Looker Studio environment. After purchasing, you receive a link to the template, which you can then copy and connect to your own YouTube Analytics data source. While Google offers a free native YouTube connector, some advanced metrics might require a third-party paid connector.
The pricing is listed in EUR, so buyers in other regions will need to account for currency exchange rates. While the template is a one-time purchase, it’s crucial to remember that any required third-party data connectors may have their own separate subscription costs. This model is perfect for users who are already comfortable within the Google ecosystem and want to elevate their reporting capabilities without being locked into another monthly SaaS subscription.
Website: https://www.databloo.com/templates/
From Data Points to Strategic Decisions
We’ve explored a diverse landscape of YouTube dashboard examples, moving from the plug-and-play simplicity of templates to the deep, custom-built analytics powerhouses. The journey through tools like Databox, Geckoboard, Klipfolio, and Supermetrics reveals a fundamental truth: a dashboard is not merely a collection of charts. It’s a strategic command center that translates raw data into a clear narrative about your audience, your content’s resonance, and your channel’s business impact.
The examples showcased are designed to be more than just inspiration; they are blueprints. Whether you’re tracking channel growth, dissecting content performance, optimizing ad revenue, or reporting on complex ad campaigns, the core principle remains the same. The most effective dashboards transform vanity metrics into actionable intelligence, enabling you to move from reactive content creation to a proactive, data-informed YouTube strategy.
Synthesizing the Key Takeaways
Recapping our analysis, several critical themes emerge that should guide your dashboard implementation:
- Goal Alignment is Non-Negotiable: The most powerful YouTube dashboard is the one built for a specific purpose. A dashboard designed to maximize ad revenue will prioritize different KPIs (like RPM and CPM) than one built for community growth (which would focus on comments, shares, and subscriber growth rate). Always start with the question, “What decision will this dashboard help me make?”
- Audience Segmentation Unlocks Growth: Don’t settle for top-level audience demographics. A truly strategic dashboard segments viewers by traffic source, geography, and content affinity. Understanding which video topics attract high-value subscribers from organic search versus social media is a powerful lever for growth.
- Performance Metrics Need Context: A spike in views is meaningless without knowing the source. A high click-through rate is only valuable if the audience retention is also strong. Your dashboard must connect the dots between discovery metrics (impressions, CTR), engagement metrics (watch time, retention), and conversion metrics (website clicks, lead form fills) to tell the complete story.
- Automation is Your Ally: The real value of these tools isn’t just visualization; it’s automation. By connecting APIs from YouTube Analytics, Google Ads, and your CRM, you eliminate manual reporting. This frees up your team’s time to focus on strategic analysis and creative execution rather than data entry.
Your Actionable Next Steps: Building Your Command Center
Feeling empowered by these youtube dashboard examples is the first step; turning that feeling into action is next. Here is a practical roadmap to get started.
- Define Your Primary Objective: Before you even look at a tool, write down the single most important goal for your YouTube channel for the next quarter. Is it lead generation? Brand awareness? Driving e-commerce sales? This North Star metric will dictate your entire dashboard structure.
- Audit Your Existing Data Sources: List all the platforms where your data lives. This will likely include YouTube Studio, Google Analytics 4, Google Ads, your CRM (like HubSpot or Salesforce), and potentially e-commerce platforms like Shopify. Knowing your sources is crucial for selecting a tool with the right integrations.
- Choose Your Tool Tier: Based on your goals and resources, select the right starting point.
- For quick insights and small teams: Start with template-driven tools like DashThis or Whatagraph.
- For growing teams needing more customization: Look to platforms like Databox or Geckoboard that offer a balance of templates and flexibility.
- For enterprise needs and deep analysis: A solution built with Supermetrics feeding into a BI tool like Looker Studio or Tableau provides maximum power and control.
- Start Small and Iterate: Don’t try to build your ultimate, all-encompassing dashboard on day one. Begin with a single dashboard focused on your primary objective. Use it for a month, see what insights you gain, and identify what’s missing. Continuously refine, add new data sources, and build new dashboard tabs as your strategic needs evolve.
Ultimately, the goal is to create a data-driven feedback loop where your content strategy informs your analytics, and your analytics, in turn, sharpens your content strategy. By embracing the principles and practical examples laid out in this guide, you can build a dashboard that serves not just as a report card, but as a roadmap for sustainable, measurable growth on YouTube.